REAL TIME DASHBOARD
Our home dashboard is snap shot of all your majors in one place. It gives you a quick overview of your sales figures, sales trend over time, inventory movement, staff and customers performance for all your outlets or individual ones however you want to view.
DETAILED SALES AND REALTIME FEED REPORTS
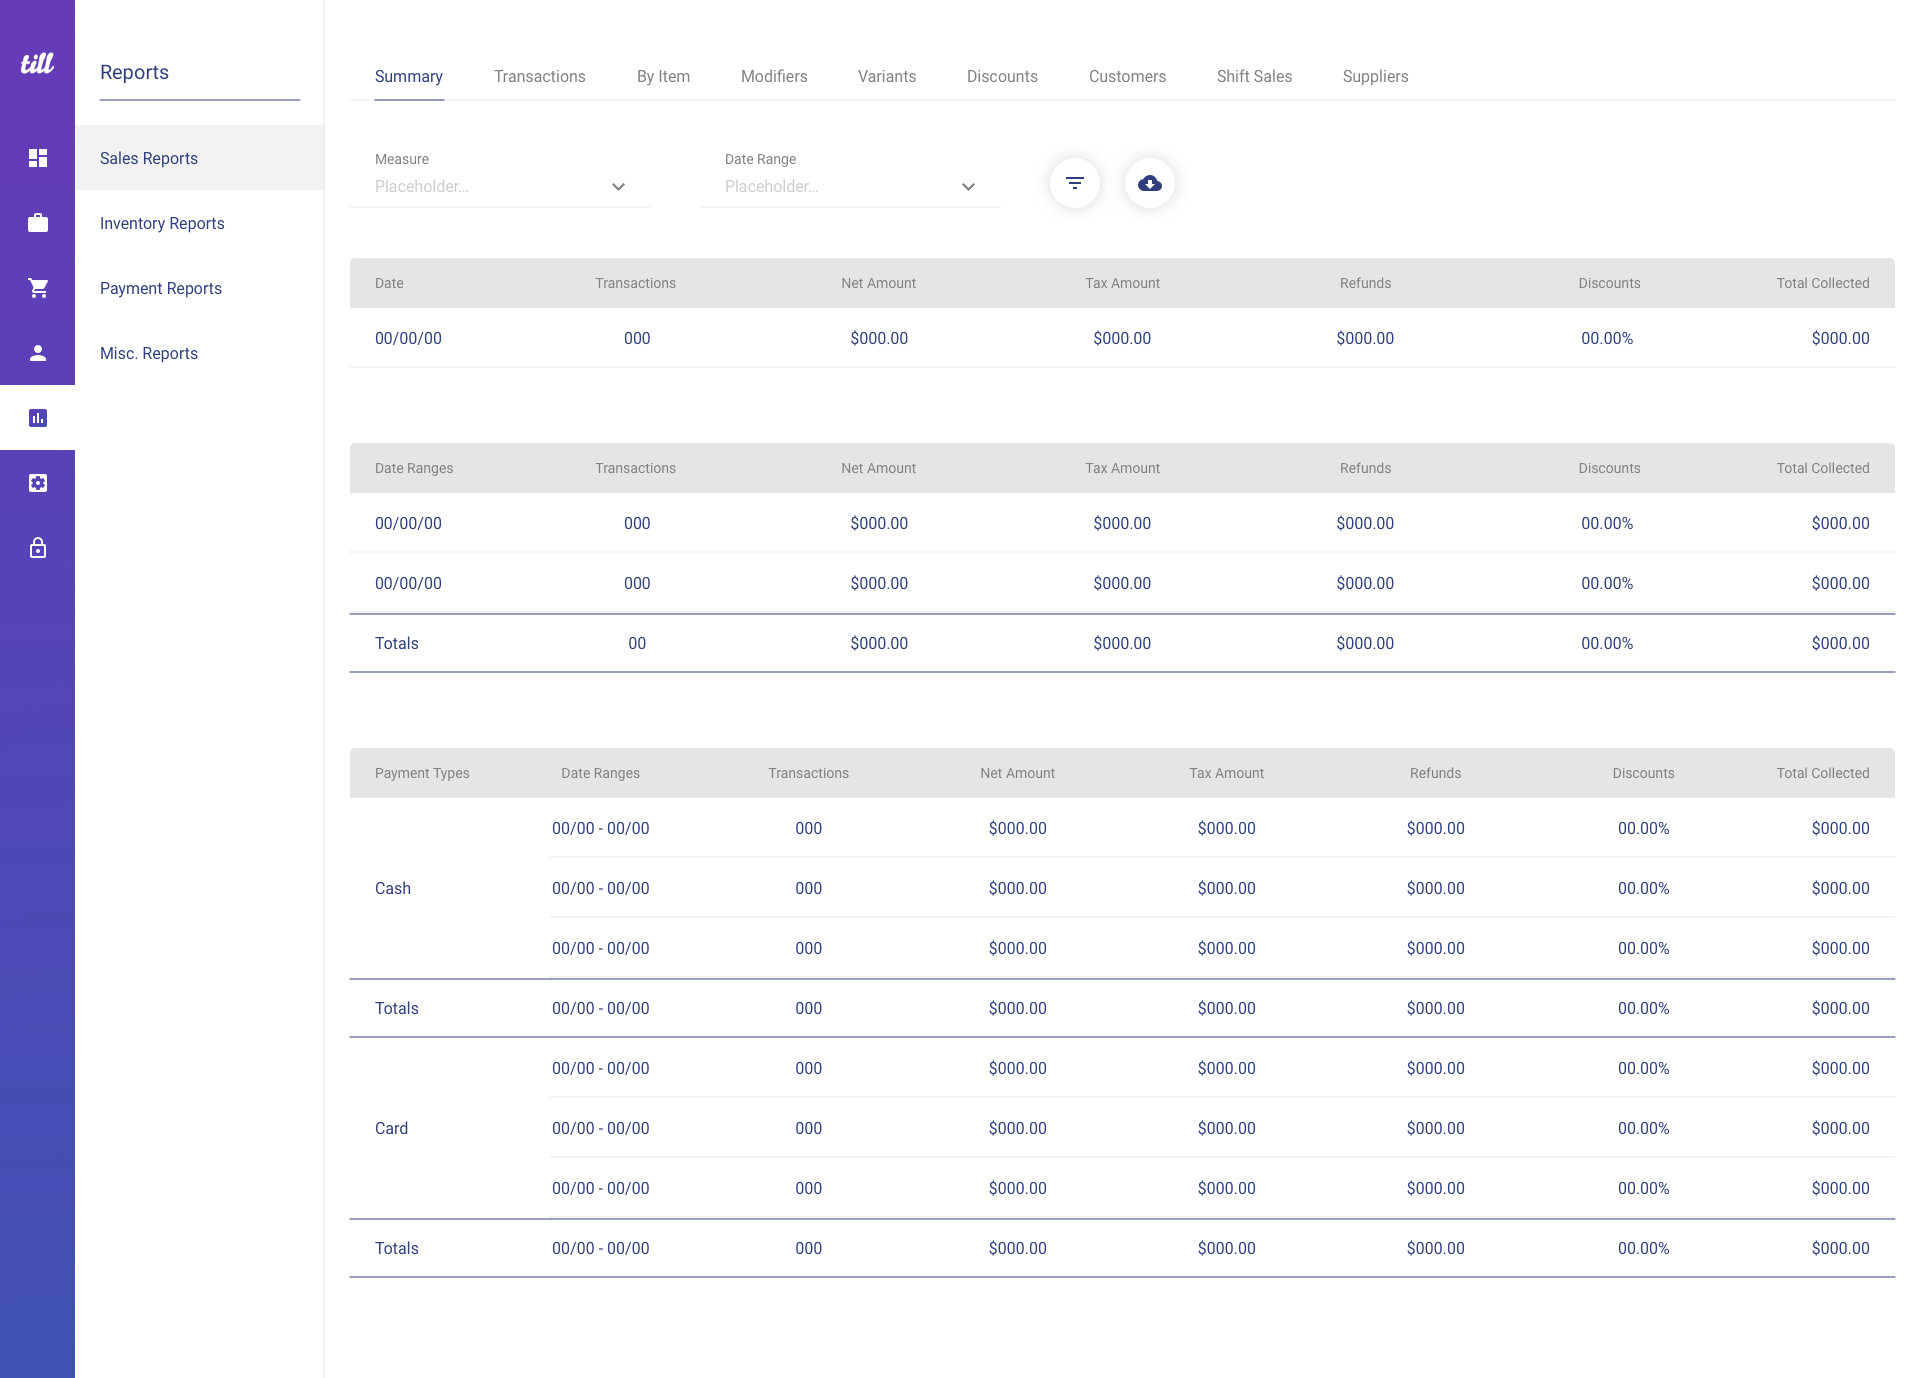
Our sales reports cover 360 degrees of ground in sales. With reports for sales by summary, feed, item, product type, shift, staff, customer, discount, cancels and refunds. Compare, and arrange the measures to suit your point of view by using functions such as split by, and sort by. Filter your findings within intervals of date range and several other measures.


EASY TAX REPORTS
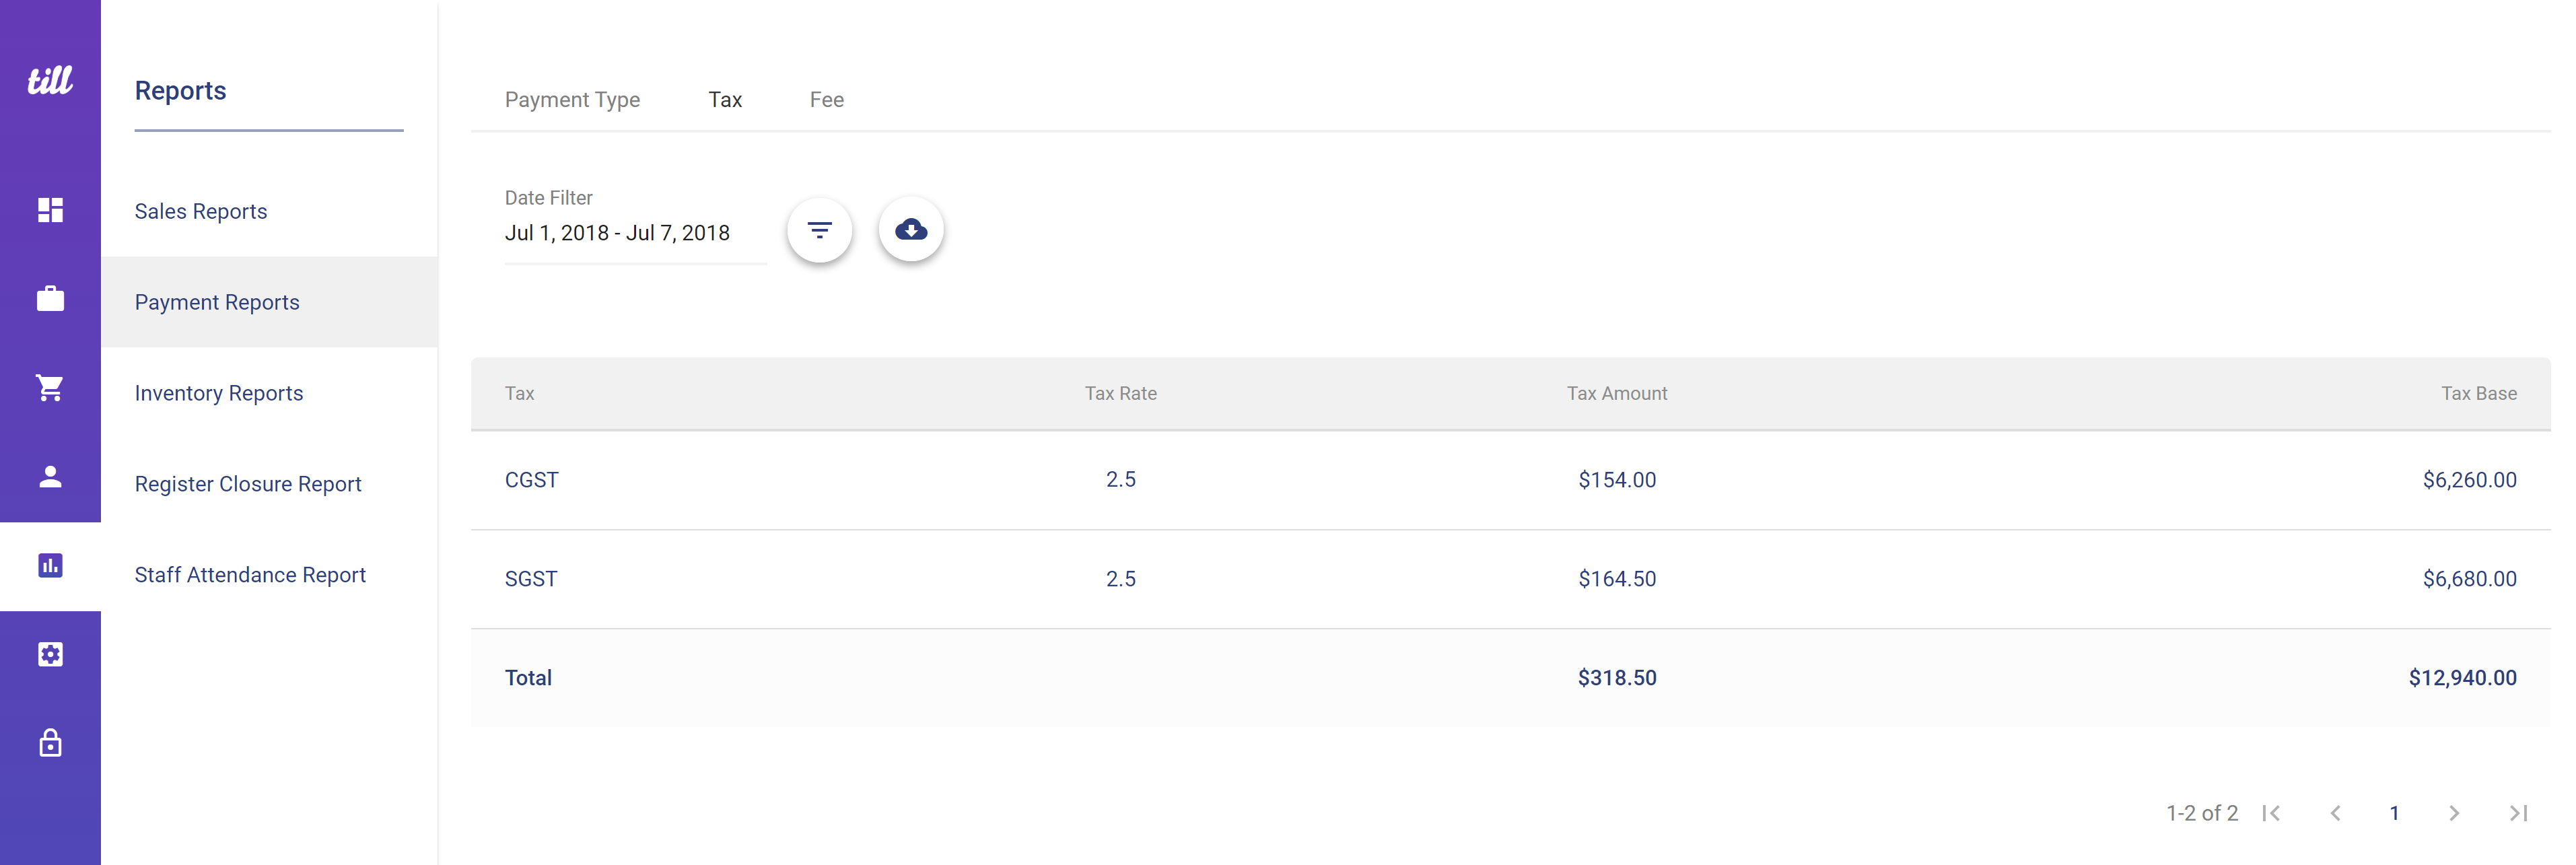
Break your taxes by tax type, and order type, within your choice of date range weekly, monthly, or quarterly. Simply export to print or email as a pdf document.
Dashboards
HOME DASHBOARDS
Our home dashboard is snap shot of all your majors in one place. It gives you a quick overview of your sales figures, sales trend over time, inventory movement, staff and customers performance for all your outlets or individual ones however you want to view.
DASHBOARDS ON THE GO
Don’t want to miss the action anytime? We are at your fingertips. All our reports are mobile friendly. Access all your key metrics and filters for your sales and inventory on your phone from anywhere. Any time.
DIVE DEEP INTO DASHBOARDS
This is your home dashboard at each module level. Charts and graphs at each module level. One for catalogue and one for inventory. One for customers and even one for Reports.
Sales Reports
COMPLETE SALES ANALYSIS
Our sales reports cover 360 degrees of ground in sales. With reports for sales by summary, feed, item, variant, modifier, shift, staff, customer, discount, cancels and refunds. Compare or arrange the measures to suit your point of view by using functions such as split by, and sort by
CAMPAIGNS AND COMBOS ANALYSIS REPORTS
Campaigns and combos work. Make your customers happy. Now watch their results on change in sales, discounts, profits, margin, change in customer loyalty through visits and amount spent, procurement of your inventory, and affected cost price. Like what you see? well, Repeat or Create a new Campaign or a Combo.
SHIFT ANALYSIS REPORTS
Break your daily sales into shift wise if you do have shifts. Review your payments and sales through various channels shift wise. Check for any discrepancies and easily find reasons and then solve them.
Product Reports
BE ON TOP OF YOUR INVENTORY
Never over or under stock yourselves. Manage your purchases, stock value, stock transfers, stock variance, and wastage from purchases report; stock in hand report, stock transfer report, stock count report, and wastage report respectively.
PRODUCT PERFORMANCE REPORTS
Dive into the world of your products through the product performance report. Starting from suppliers to cost price to profits to inventory to up sell potential to customers’ choice to discounts to refunds, cover all ground at product level.
Human Resource Reports
CUSTOMER ANALYSIS REPORTS
Get a convex view of your customers, individual and group wise, through our customer reports. With measures such as profit percent, frequency between visits, discounts, balance, favourite items, and favourite days, always stay a step ahead than your customers and be able to serve better than their expectations.
STAFF ANALYSIS REPORTS
Track your staff’ performance by day, week, month, or by special days like weekend, holidays, etc. also compare sales done, transactions made, profits made, customers served between peers.
TAX REPORTS
Have more than one form of tax and applied differently at different channels while some are inclusive and some exclusive? We had you in mind. Break your taxes by tax type, and order type, within your choice of date range weekly, monthly, or quarterly. Simply export to print or email as a PDF document.

